

Business and key financials
Get to know Uniper: Our business segments and key financial data at a glance
Uniper's business and corporate segments
Uniper Group
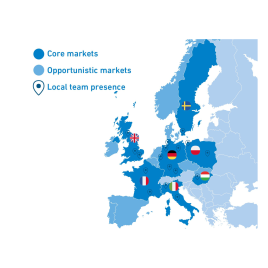
Düsseldorf-based Uniper is a European energy company with global reach and operations in more than 40 countries. It has about 7,000 employees and plays a key role in ensuring a secure energy supply in Europe, particularly in its core markets of Germany, the United Kingdom, Sweden, and the Netherlands. Uniper’s 13 gigawatts of flexible power generating capacity make it a mainstay of reliable power production. Uniper is a leading gas trader and one of Northwestern Europe’s most important LNG importers, and its broad procurement portfolio enhances supply security. Uniper’s investments in renewables, hydrogen, and other low-carbon energy carriers propel the transformation of the energy system.
Uniper provides energy and services to about 1,000 municipalities and industrial companies in its home market, Germany. Uniper is also Germany’s largest operator of gas storage facilities and hydropower plants.
2025 key figures on the right
€60955m
External sales
€1097m
Adjusted EBITDA
-€662m
Operating cash flow before interest and taxes
€932m
Investments
Green Generation
The “Green Generation” business segment encompasses both renewables and nuclear power generation plants operated by the Uniper Group in Europe. In detail, these are Uniper’s hydropower plants (run-of-river, storage, and pumped-storage plants) in Germany and Sweden and the nuclear power plants in Sweden as well as our wind and solar power developments. To achieve climate-neutral power generation, renewable sources will play a crucial and increasing role in the future. For this reason, in the Green Generation segment we are focusing on the development, construction, and operation of wind and solar plants in various European countries. Furthermore, we are investing into the modernization and extension of selected hydro assets.
2025 key figures on the right
€309m
External sales
€626m
Adjusted EBITDA
€561m
Operating cash flow before interest and taxes
€438m
Investments
Flexible Generation
The expanded use of renewables alongside the retirement of significant parts of today’s fossil-fired generation capacity in Uniper’s core markets increases the need for flexible generation. The "Flexible Generation" business segment includes power and heat generation plants operated by Uniper in Europe to meet the requirements of network operators for grid stability and supply security, especially when renewables generation plants are not sufficiently available, for example, during times of “Dunkelflaute,” a simultaneous occurrence of darkness and a lull in wind activity.
For this purpose, gas-fired power plants, and, if necessary, coal and oil power plants are used to make an important contribution to supply security in Uniper’s core markets. To support the transition towards decarbonization while continuously aiming to fulfill that crucial role, we plan to entirely phase out our commercial coal-fired generation portfolio by 2029, convert parts of our gas-fired generation portfolio, and build new dispatchable capacities with net-zero potential. Existing gas-fired power plants are to remain in the portfolio in the long term, as well as new builds, which will increasingly be able to use hydrogen or other low-carbon fuels as well as Carbon Capture and Storage (CCS) and Carbon Capture and Usage (CCU) technologies.
2025 key figures on the right
€2203m
External sales
€596m
Adjusted EBITDA
€120m
Operating cash flow before interest and taxes
€319m
Investments
Greener Commodities
Since full decarbonization will take time, we anticipate that natural gas will continue to be a crucial energy source globally in the coming years. The “Greener Commodities” business segment consolidates energy trading and optimization activities and serves as the commercial interface between the Uniper Group, global trading markets, and major customers.
Uniper’s gas portfolio consists of long-term agreements with gas suppliers, shorter-term purchases, distributing natural gas to resellers, large industrial customers, and power plants, or selling it on international markets. Additionally, this segment includes gas storage operations and other infrastructural investments such as the LNG business. It is planned that the "Greener Commodities" segment will increasingly import, trade, and, in some cases, process or store renewable and low-carbon gases and fuels such as biomethane, hydrogen, and hydrogen derivatives such as ammonia or methanol. While hydrogen is a key focus area for us, we are also growing our portfolio of renewable Power Purchase Agreements (PPA) and Guarantees of Origin (GoO).
2025 key figures on the right
€58439m
External sales
€16m
Adjusted EBITDA
€1566m
Operating cash flow before interest and taxes
€135m
Investments
Key financial data
Unit |
2025 |
2024 |
2023 |
2022 |
2021 |
2020 |
|
|---|---|---|---|---|---|---|---|
Sales |
€ in millions |
60,955 |
69,636 |
107,915 |
274,121 |
162,968 |
50,968 |
Adjusted EBITDA² |
€ in millions |
1,097 |
2,612 |
7,164 |
-10,119 |
1,512 |
1,657 |
Adjusted EBIT² |
€ in millions |
568 |
2,001 |
6,367 |
-10,877 |
955 |
998 |
Net income/loss |
€ in millions |
1,426 |
221 |
6,336 |
-19,144 |
-4,106 |
402 |
Earnings per share³ ⁴ |
€ |
3.35 |
0.71 |
15.15 |
-51.92 |
-11.39 |
1.08 |
Dividend proposal / Dividend per share⁴ |
€ |
0.72 |
0.00 |
0.00 |
0.00 |
0.07 |
1.37 |
Cash provided by operating activities (operating cash flow) |
€ in millions |
-814 |
1,665 |
6,549 |
–15,556⁵ |
3,296 |
1,241 |
Adjusted net income² |
€ in millions |
544 |
1,653 |
4,432 |
-7,401 |
743 |
774 |
Investments |
€ in millions |
932 |
710 |
587 |
552 |
589 |
743 |
Growth |
€ in millions |
408 |
316 |
198 |
189 |
293 |
406 |
Maintenance and replacement |
€ in millions |
525 |
394 |
389 |
363 |
297 |
336 |
Economic net debt (+)/ net cash position (−) |
€ in millions |
-2,823 |
-3,404 |
-3,058 |
3,410 |
324 |
3,050 |
Unit |
2025 |
2024 |
2023 |
2022 |
2021 |
2020 |
|
|---|---|---|---|---|---|---|---|
Power purchases and owned generation |
Billion kWh |
129.1 |
147.8 |
210.3 |
289.7 |
413.6 |
558.0 |
Electricity sales |
Billion kWh |
127.3 |
146.6 |
209.5 |
288.9 |
412.9 |
552.9 |
Gas volume sold |
Billion kWh |
1,118.1 |
1,336.3 |
1,637.7 |
1,661.5 |
2,258.5 |
2,205.9 |
Direct fuel-derived carbon emissions |
Million t CO₂ |
11.7 |
14.2 |
19.4 |
55.6 |
50.9 |
42.6 |
Employees as of the reporting date |
7,238 |
7,464 |
6,863 |
7,008 |
11,494 |
11,751 |
€ in millions |
2025 |
2024 |
+/- % |
|---|---|---|---|
Electricity |
12,104 |
12,443 |
-2.7 |
Gas |
45,216 |
54,700 |
-17.3 |
Other |
3,636 |
2,494 |
45.8 |
Total |
60,955 |
69,636 |
-12.5 |
€ in millions |
2025 |
2024 |
+/- % |
|---|---|---|---|
Green Generation |
626 |
498 |
25.8 |
Flexible Generation |
596 |
998 |
-40.3 |
Greener Commodities |
16 |
1,497 |
-99.0 |
Administration/Consolidation |
-140 |
-381 |
63.3 |
Total |
1,097 |
2,612 |
-58.0 |


